Project calculations
Project calculations
Project calculations
Experience
---- Project Calculations ----
---- Project Calculations ----
---- Project Calculations ----
---- Project Calculations ----
---- Project Calculations ----
ORTEC
Software that allows the user to calculate demands and forecast and convert it into shifts.
My role
-
UX design
-
Usability/ user testing
-
UX and design research
-
User research
UX products
-
Research
-
Job stories
-
Taskflows/ wireflows
-
Wireframes
-
Prototypes
-
Workshops
-
User tests
-
Digital writings
-
...much more

*Disclaimer: due to the non-disclosure agreement with the company, I am limited in the work and information I can share. That is why I have given this project a fictional name and only show some sketches.
About the project
This is an ongoing project I am working on for ORTEC. Together with a team I am working on developing software which allows the user to calculate forecasts, demands and shifts. We are working Agile, and I am the UX designer for the project. This is a complex process and requires a lot of data input.
The software is meant for clients who work with lots of employees and where the demand for employees to work shifts varies based on the forecast of visitors. Examples of clients could be hospitals, airports or big retail stores, we have a global audience.
Our goals is to optimize the calculation process for the user and take away the complexity of the process, by providing them with usable and easy to understand software. The user is not an avid user of technology, but rather someone who works in the field. However, they do know what the data input for the calculations should be.
Challenges
-
The calculations are complex and this could lead to complex software as well. Complex software is not user friendly.
-
The persona is very specific and inexperienced when it comes to working with software, let alone complex software.
-
The user is very set in his ways of working and thinking.
-
Due to the pandemic it is difficult to contact or even approach the user. This means that user testing is limited, or not at all possible.

Process
Planning/briefing
Research
Design concepts
Feasibility check (tech)& User test
Final tasks & Development
-
Plan what UX is going to do during the sprint. I work a couple sprints ahead of the team.
-
Refine high level job stories.
-
Talk to the relevant stakeholders for this step.
-
Plan and make an estimation how much time and work the tasks will take.
-
Discussions and interviews with the Product owner (PO) for more context and functional requirements.
-
Talk to the lead developer to discuss technical boundaries, so this can be kept in mind while designing.
-
Define and refine scenario's, create persona's.
-
User research, user interviews, observations, survey's.
-
High level (task) flows.
-
Process findings of all the research mentioned above.
-
Brainstorm sessions.
-
Make sketches.
-
Design wireflows and wireframes.
-
Verify with relevant stakeholders.
-
User test if possible, if so, make a (interactive) prototype.
-
Validate with lead developer if the designs and flows (=UX/UI) is technically feasible.
-
Discuss alternatives if there are challenges or difficulties.
-
Discuss how to handle everything that is not feasible, either we do this in later sprint or the UX/UI needs to be adjusted.
-
Prepare user/usability test sessions, write the test scenario and questions to ask the user.
-
Conduct and process the user/usability test result.
-
Discuss the findings with the relevant stakeholders.
-
Finalize the digital writings.
-
Finalize the UX/UI.
-
Kick-off the UX/UI with the rest of the team by giving a demo.
-
During development the team always has some questions regarding UX. We solve this on the spot, or within a fast time frame, so the sprint goals can still be met.
-
Always keep up-to-date with what the developers are doing to tackle issues of they occur.
-
Issues that cannot be resolved right now should be noted down for the future.
It is important that I mention that feedback is a constant thing for each step in the process. At every possible and necessary point I ask feedback from the relevant stakeholders, teammates and of course users. If I notice that we are not aligned and cannot come to common ground, I go back to the drawing board and think of new concepts that fit better with the needs and expectations. Iteration is a major and important part of the whole design process and that defines the way of working, but it’s also a very UX thing to do. I always iterate as much as I can and I gather as much feedback as possible during each project. Always improve until the user needs are met, within the boundaries of the project of course.
My role
UX designer
The team has an Agile way of working, we work with SCRUM. Each UX designer is assigned multiple projects to work on and for which they are responsible. We also have a UI designer in our team for this project. Together with the UI designer I form a duo and we are responsible for everything related to UX/UI within this project. I work closely with the Product owner (PO), before we kick off the work that should be done, we discuss what is feasible within the timeframe we have. After gathering input from the PO and other relevant stakeholders, I start the UX work. Continuous contact with PO, stakeholders and developers is important. Keep collecting feedback and iterating until all goals are met. Which means technical feasibility, business goals of ORTEC, business goals of the client but most importantly user needs and usability.
I spend most of my time working on job stories, and like the Pareto principle explains, most of the time is spent on only 20% of them. That is why I always try to identify, together with the PO, what the most important job stories are. The rest will be picked up later, this way I can focus.
Tools and methods
-
Design system of ORTEC
-
UX and design research
-
Wireframes and flows
-
Usability testing
-
UX laws
-
Gestalt principles
-
User research
-
Interviews with stakeholders
-
Test scenario's
-
User interviews
-
Brainstorm sessions
-
Write digital text and materials
-
...much more!

Findings and solutions
The user is not very experienced so how do we solve this when the software is complex; we solve most of it in the back-end! We have some amazing minds at ORTEC and optimizing difficult processes and calculations are things that the company is best at.
There are two major parts in the software; starting the calculation itself and the configuration settings. We simplified the calculation process by using Hick’s law, we simplified the complex steps into smaller steps. The calculation results are visualized into a chart, since the user is used to this. Text would be too much numbers and not user friendly, with the chart they have an overview of e.g. a certain period. But they can also zoom in on each separate chart line and see the calculated data in more detail. The chart has many layers and the user is in charge of how deep they dive into it.
The configuration settings are also very clear, we don’t overwhelm the user with too many options and possibilities. For this we also made separate steps, but not in the form of a stepper. We have a separate menu for the configuration settings where we have grouped the relevant steps together. Each step has its own page where the user again has limited, but enough, options to be nudged into the right direction.
Hick’s law, user friendly software, easy calculations
I had the chance to speak to one user, during this user test he gave quite some feedback. He told me that we use very specific terms for the objects and that this is confusing. So what did I do, I made very easily understandable terms. I also use very simple text for the messages, and pretty much everywhere else in the software. Other than the complex terms, the flow was very clear and easy to follow.
Nudges the user into the right direction, user/usability test done.
These are the rough sketches of the stepper and the chart view. I cannot share any of the original visuals, only the sketches we made very early on in the process. The sole purpose is to visualize the flow I described above.


For users that are not very experienced in using software, it is important to make sure to incorporate patterns that they do recognize and understand. That is what we did, we based it on other ORTEC software that they are familiar with.
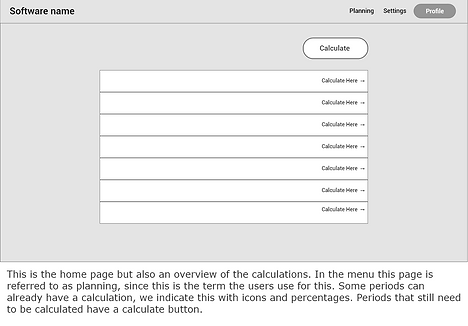
On the home/planner page we have an overview. The user can see which calculations are already made and what is left. All the relevant information is either positioned on the beginning of the row or at the end, as explained in the serial position effect.
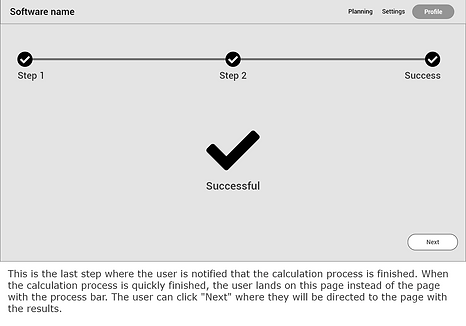
The process bar keeps the user informed of the status while calculating. They now how much time is left.
Jakob’s law, serial position effect, Zeigarnik effect, common region, similarity, figure-ground
The project is still in the middle of development and is going to expand much more in its features. For now I can't show more examples, but I hope to do so soon! You can always reach out for more information if this project seems interesting to you :)
Highlights at ORTEC so far...
The biggest highlight has been the workshop I gave together with a colleague. This was an internal workshop, meant for our colleagues, non-UX'ers, but with an interest in UX/UI. I plan to give more workshops in the future. This also helps to promote UX and the relevance of it within the organization. I believe it is important to educate yourself and others if possible. Keep learning and growing.
To be able to work on such complex assignment, but being able to simplify this with a good UX/UI is an amazing feeling.
Every single user/usability test! I enjoy these very much, talking and getting to know the user. Learning from them, but also being able to give back in form of software that helps them in their daily work.
